A Step-by-Step Guide to Using Business Intelligence Software
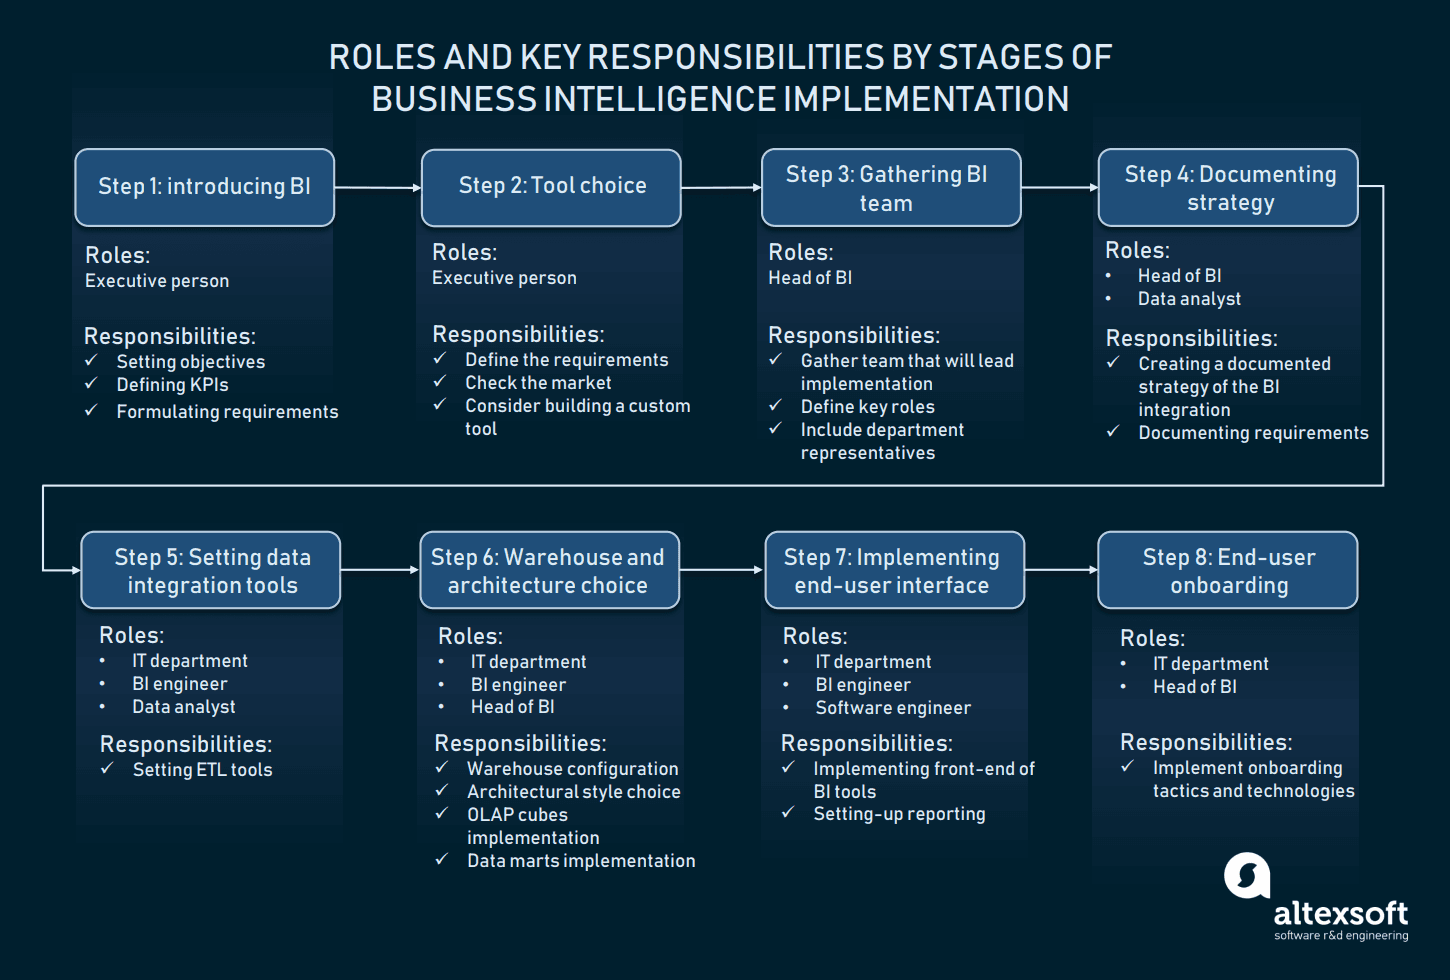
In today’s fast-paced business world, making informed decisions is crucial for success. Business intelligence (BI) software has become an essential tool for organizations to analyze their data, identify trends, and make data-driven decisions. However, with so many BI software options available, it can be overwhelming to know where to start. In this article, we will provide a step-by-step guide to using business intelligence software, from selecting the right tool to creating insightful reports.
Step 1: Define Your Business Goals and Objectives
Before selecting a BI software, it’s essential to define your business goals and objectives. What do you want to achieve with your BI software? Are you looking to improve sales, reduce costs, or enhance customer satisfaction? Identifying your goals will help you determine the type of data you need to analyze and the features you require from your BI software.
Some common business goals that can be achieved with BI software include:
- Improving sales forecasting and pipeline management
- Enhancing customer segmentation and personalization
- Optimizing supply chain management and logistics
- Reducing operational costs and improving efficiency
- Improving financial reporting and planning
Step 2: Choose the Right BI Software
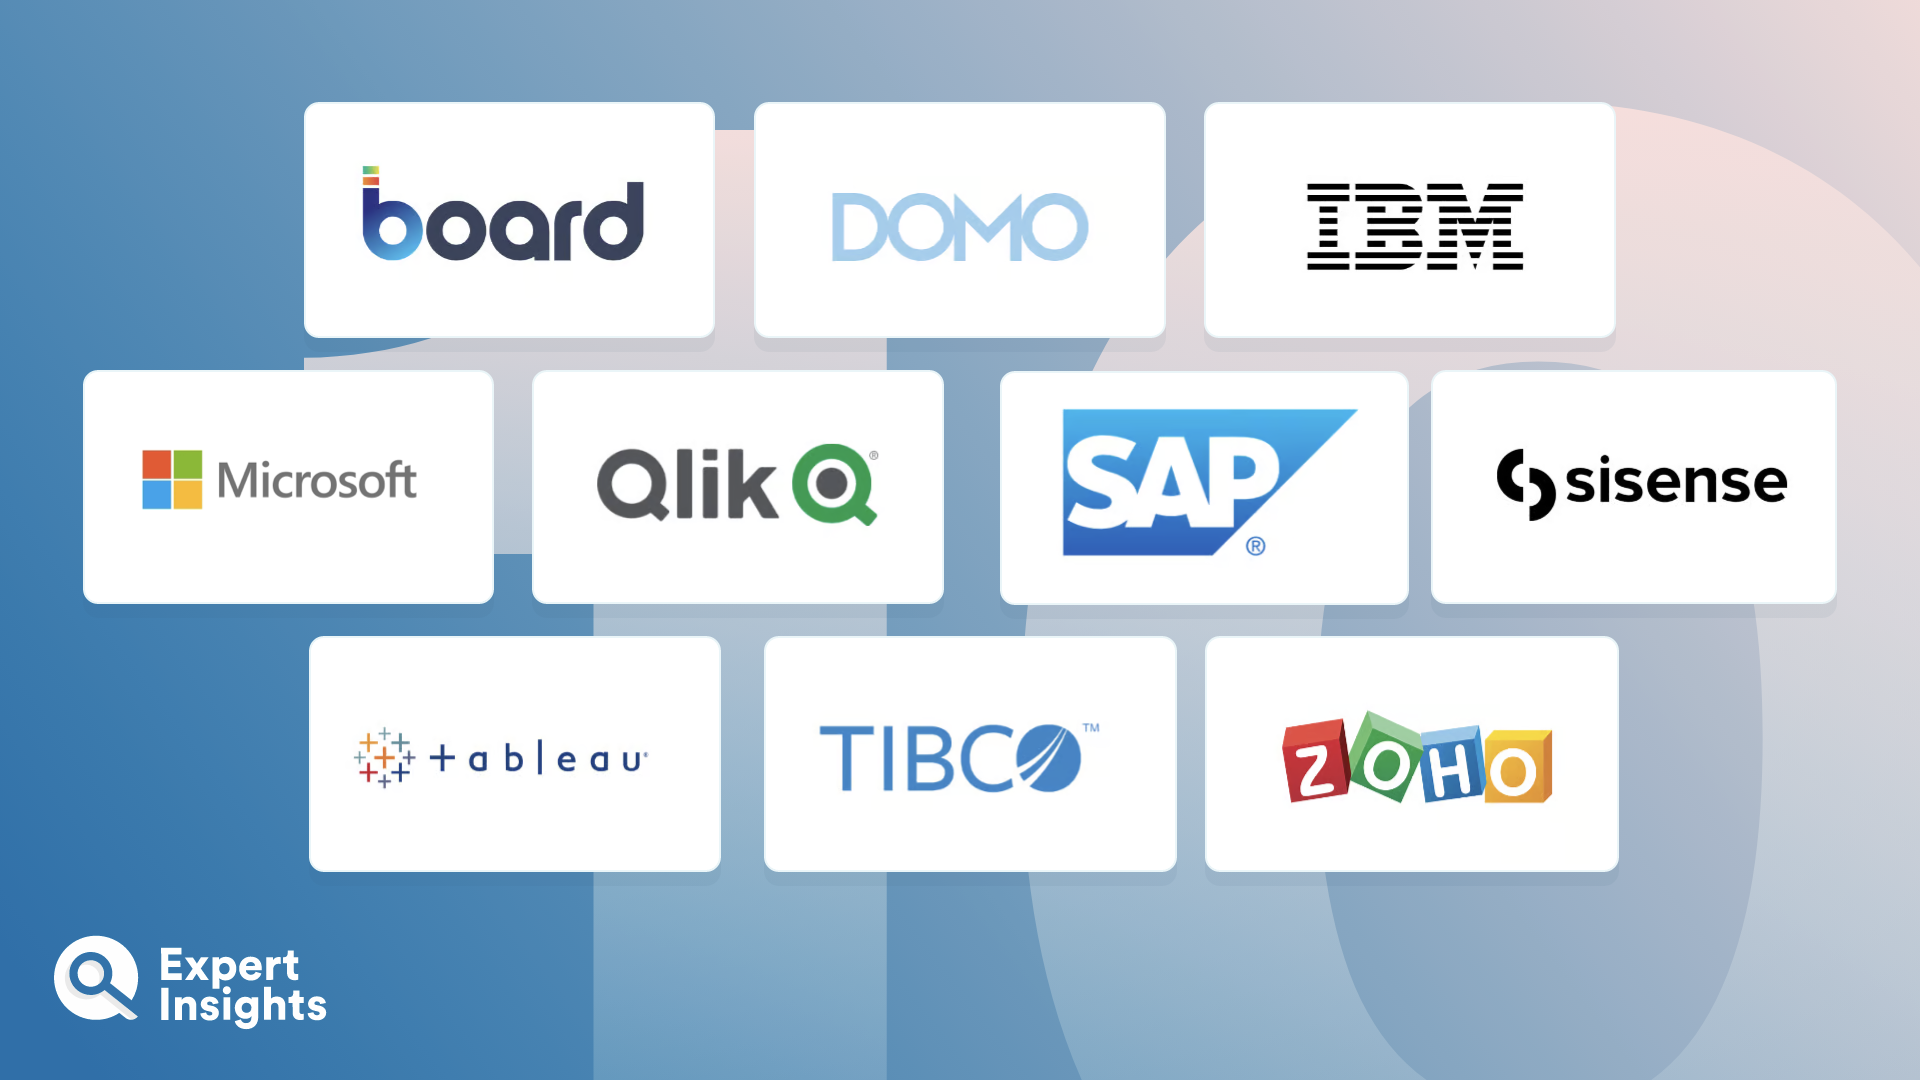
With your business goals in mind, it’s time to choose the right BI software for your organization. There are many BI software options available, each with its strengths and weaknesses. Some popular BI software options include:
- Tableau
- Power BI
- QlikView
- SAP BusinessObjects
- Oracle Business Intelligence
When selecting a BI software, consider the following factors:
- Ease of use: How easy is the software to use, especially for non-technical users?
- Data connectivity: Can the software connect to your existing data sources, such as databases, spreadsheets, and cloud storage?
- Data visualization: What types of data visualizations are available, such as charts, tables, and maps?
- Reporting and dashboarding: Can the software create interactive reports and dashboards?
- Scalability: Can the software handle large volumes of data and user adoption?
- Cost: What is the total cost of ownership, including licensing, implementation, and maintenance?
Step 3: Connect to Your Data Sources
Once you’ve selected your BI software, it’s time to connect to your data sources. This may include:
- Databases: such as MySQL, Oracle, or SQL Server
- Spreadsheets: such as Excel or Google Sheets
- Cloud storage: such as Amazon S3 or Google Cloud Storage
- Big data platforms: such as Hadoop or Spark
Your BI software should provide connectors or APIs to connect to your data sources. You may need to provide login credentials, such as usernames and passwords, to authenticate with your data sources.
Step 4: Design Your Data Model
With your data sources connected, it’s time to design your data model. A data model is a representation of your data, including tables, fields, and relationships. Your BI software should provide a data modeling tool to help you design your data model.
When designing your data model, consider the following:
- What data entities do you need to analyze, such as customers, products, or orders?
- What fields do you need to include in your data model, such as names, addresses, or dates?
- What relationships exist between your data entities, such as a customer placing an order?
Step 5: Create Data Visualizations
With your data model designed, it’s time to create data visualizations. Data visualizations are graphical representations of your data, such as charts, tables, and maps. Your BI software should provide a range of data visualization tools to help you create interactive and insightful visualizations.
Some common data visualizations include:
- Bar charts: to compare categorical data
- Line charts: to show trends over time
- Scatter plots: to show relationships between variables
- Maps: to show geographical data
- Tables: to display detailed data
Step 6: Create Reports and Dashboards
With your data visualizations created, it’s time to create reports and dashboards. Reports are static or dynamic documents that provide insights into your data, while dashboards are interactive and dynamic views of your data.
Your BI software should provide reporting and dashboarding tools to help you create insightful and interactive reports and dashboards. Consider the following:
- What data visualizations do you want to include in your reports and dashboards?
- What filters and drill-down capabilities do you need to include?
- What security and access controls do you need to apply to your reports and dashboards?
Step 7: Deploy and Maintain Your BI Solution
With your reports and dashboards created, it’s time to deploy and maintain your BI solution. This may include:
- Deploying your BI software to your production environment
- Configuring security and access controls
- Providing training and support to your users
- Monitoring and maintaining your BI solution to ensure data freshness and integrity
Best Practices for Using Business Intelligence Software
To get the most out of your BI software, consider the following best practices:
- Start small: begin with a small pilot project to test and refine your BI solution
- Focus on business outcomes: align your BI solution with your business goals and objectives
- Involve stakeholders: engage with stakeholders to ensure your BI solution meets their needs and expectations
- Provide training and support: provide ongoing training and support to your users to ensure they get the most out of your BI solution
- Continuously monitor and evaluate: continuously monitor and evaluate your BI solution to ensure it remains effective and relevant
Conclusion
Business intelligence software has become an essential tool for organizations to analyze their data, identify trends, and make data-driven decisions. By following the steps outlined in this guide, you can successfully implement a BI solution that meets your business needs and objectives. Remember to define your business goals, choose the right BI software, connect to your data sources, design your data model, create data visualizations, create reports and dashboards, and deploy and maintain your BI solution. With the right BI software and best practices, you can unlock the full potential of your data and drive business success.
Closure
Thus, we hope this article has provided valuable insights into A Step-by-Step Guide to Using Business Intelligence Software. We appreciate your attention to our article. See you in our next article!


